Introduction
|
Boundary contours are extended and continuous in nature (hence an inherently non-local
phenomenon). Any boundary-related vision problem (such as contour completion)
requires a
good understanding, and accurate modeling, of the characteristics of contours
in natural images.
We utilize a large dataset of human-segmented natural images (the Berkeley Segmentation Dataset BSDS) and
study the human-marked boundaries in these segmentations. One of the most
important findings in our empirical work is that (consistent with our
intuitions) boundary contours are scale-invariant in nature.
|
Scale Invariance in Natural Images
|
Scale-invariance is a fundamental phenomenon in vision. It is widely
accepted (often on naive or intuitive grounds) that visual information in
natural images spans an entire range of scales, and the characteristics of the
structures in this continuum are largely similar to one another.
|
|
A more careful
analysis suggests that there are at least two major sources of multi-scale structure:
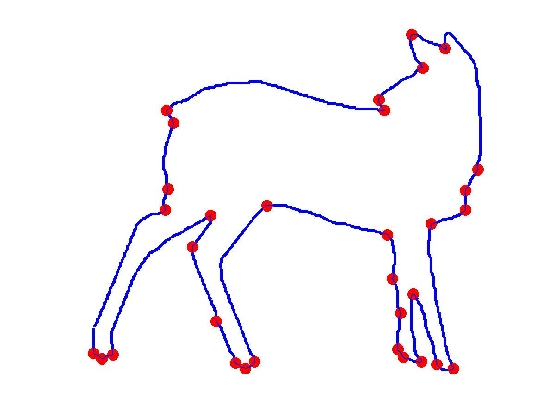
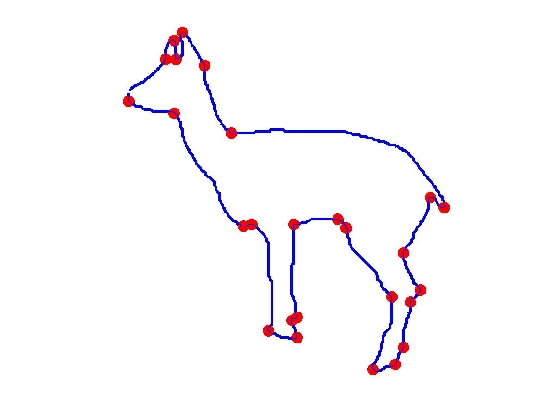
- Arbitrary viewing distance: an object may appear at any distance
to the observer. As the information about absolute scale is lost in the imaging
process, an object at half the distance looks as if having twice the
dimensions. Figure 1 shows an example.
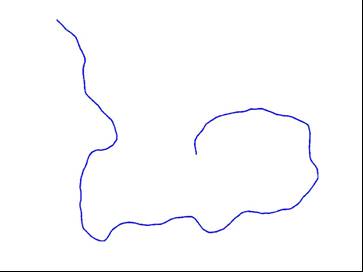
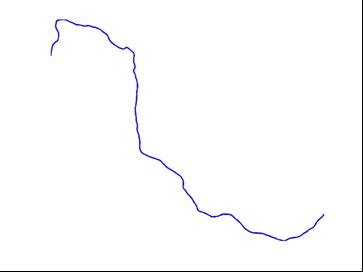
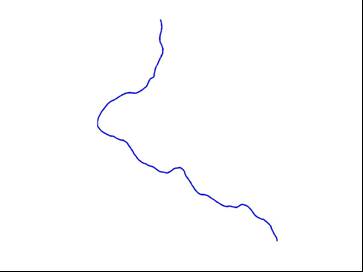
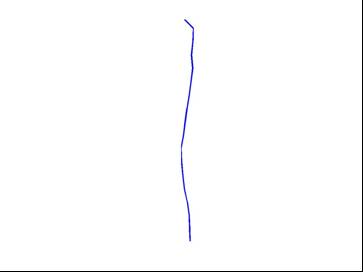
- Hierarchy of parts in a single object: objects in the natural world
are themselves multi-scale as they consist of parts at various scales. For
example, Figure 2 shows the boundary of a human body which
has a hierarchy of parts: head, torso, arms, legs, fingers, hair, each with its
own distinct scale. Many natural forms exhibit this fractal-like structure.
|
|
| |
 |
| Figure 1: arbitrary viewing distance |
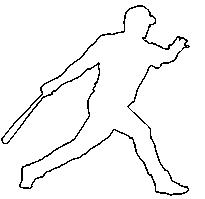 |
| Figure 2: hierarchy of parts |
|
|
In recent years scale-invariant phenomenon have been extensively studied
through the use of natural image statistics. Power laws of various kinds have
been discovered, most noticeably in the power spectra and wavelet coefficients
of natural images.
|
Power Laws in Boundary Contours
|
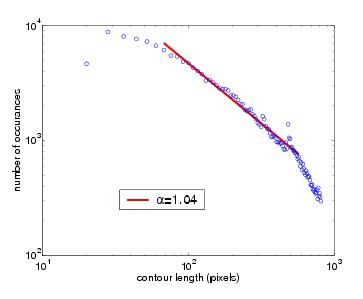
For this Berkeley Segmentation Dataset, it has been reported that the empirical distribution of region size roughly follows a power law with exponent ≈ 1. We find that for a boundary contour C, where C is the boundary between two adjacent regions, its length |C| follows a similar power law (see Figure 3).
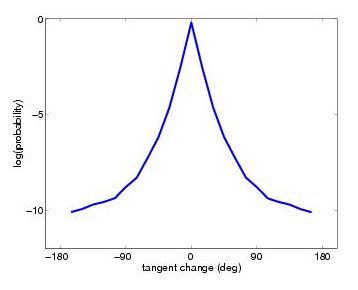
Are the human-marked contours smooth? Suppose we travel along a contour C and estimate the tangent directions at each location t. Figure 4 shows the empirical distribution of the tangent change ΔT = T(t+1)-T(t). This distribution has the two characteristics commonly found in natural images: (1) it is sharply peaked around 0; and (2) it has a heavy tail.
|
|
|
|
Figure 3: empirical distribution of contour length |C| in human-marked
segmentations. The power law suggests scale-invariance.
|
Figure 4: marginal distribution of tangent change ΔT, peaked at zero with a heavy tail.
|
|
A more interesting question is to study the statistical properties of contour
C itself. Traditionally people make the Markov assumption about C: suppose
the curvature κ is white noise, the tangent T is then a random walk; i.e.,
the distribution of T(t+1) only depends on T(t). This Markov model then leads
to efficient computation using dynamic programming.
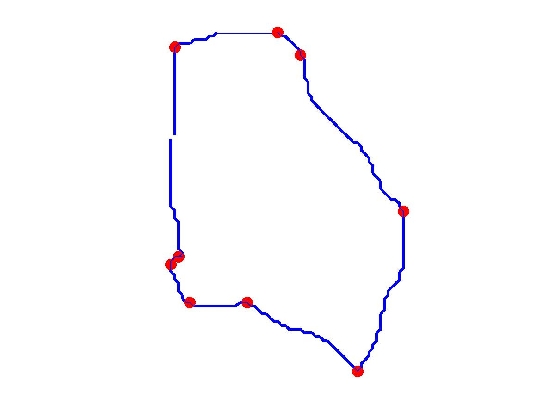
| Figure 5: breaking up contours at high-curvature locations.
|
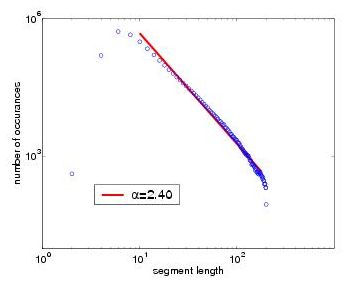
To check the validity of this model, we take a contour C and break it into
segments S at high-curvature locations. Now, if the Markov assumption were
true, then when we travel along a contour, at each step there is a constant
probability that a high curvature event fires. Then the length of contour
segment |S| is the waiting time between two high curvature events and it should
have an exponential distribution. Figure 6 shows the empirical
distribution, which is again a power law. Therefore we conclude that
empirically the Markov assumption does not hold. Not so surprising, as
the Markov model is not scale-invariant.
|
|
|
|
Figure 6: marginal distribution of contour segment length |S| between
high-curvature locations. The Markov model predicts an exponential distribution
but the empirical distribution is a power law.
|
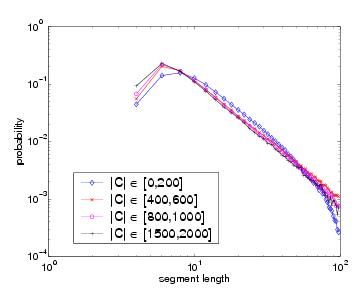
Figure 7: distributions of contour segment length |S| conditioned on |C| (an indication of apparent object size). No significant difference for various ranges of |C|, indicating that contours are fractal-like.
|
|
Is the scale-invariance soley due to arbitrariness in viewing distance? If so,
when |C| is large (i.e. the object is large), we should expect that the
contours are smooth and |S| should be large too. Figure 7 shows
the distributions of |S|, conditioned on various ranges of |C|. There is no
significant difference between these distributions, indicating that natural
contours are fractal-like.
Similar power laws can also be found in the distribution of curvature.
|
Incorporating Scale Invariance
|
Most existing vision algorithms ignore the scale-invariance of natural images
and operate at a fixed scale (or a few selected ones). It is our belief that
scale-invariance will become more and more important as we move to tackle more
realistic vision problems.
One way to incorporate scale-invariance is to build a scale-invariant
representation from bottom-up, and then operate on such a representation (see
the CDT graphs).
Alternatively, instead of a Markov model we could use a multi-scale Markov
model. Imagine a scale pyramid where the contour C becomes coarser and coarser
as we subsample it. We can then develop a model
P(T(t+1)|T(t),T(1)(t+1),T(2)(t+1),...), where
T(k) is the tangent of C at scale k. We can still do dynamic
programming with this model (coarse-to-fine). Emprirical studies show that,
compared to the Markov model P(T(t+1)|T(t)), the additional terms provide a
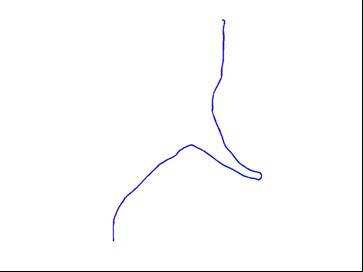
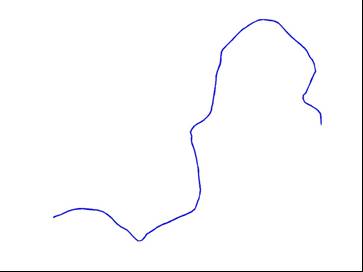
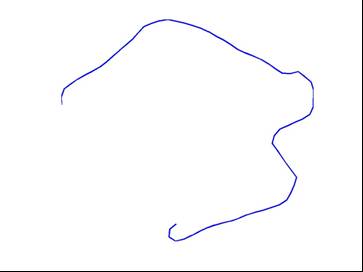
significant amount of extra information. Figure 8 shows some contours
synthesized from the multi-scale Markov model, along with some from the
first-order model.
|

|
|
|
Figure 8: contours synthesized from the first-order Markov model (row 1) and
the multi-scale model (row 2). The samples from the first-order model look like
random walks; while the samples from the multi-scale model exhibit large-scale
structures (such as the straight line) as well as details.
|
|
References
- A Probabilistic Multi-scale Model for Contour Completion Based on Image Statistics.
[abstract]
[pdf]
[ps]
[bibtex]
Xiaofeng Ren and Jitendra Malik, in ECCV '02, volume 1, pages 312-327, Copenhagen 2002.
- The Ecological Statistics of Good Continuation: Multi-scale Markov Models for Contours.
[abstract]
[talk]
[bibtex]
Xiaofeng Ren and Jitendra Malik, in VSS 02, Sarasota, FL 2002.
|