Visualizing Losses for Binary Classification
This page hosts a Jupyter Notebook for plotting loss functions for binary classification.
Downloads:
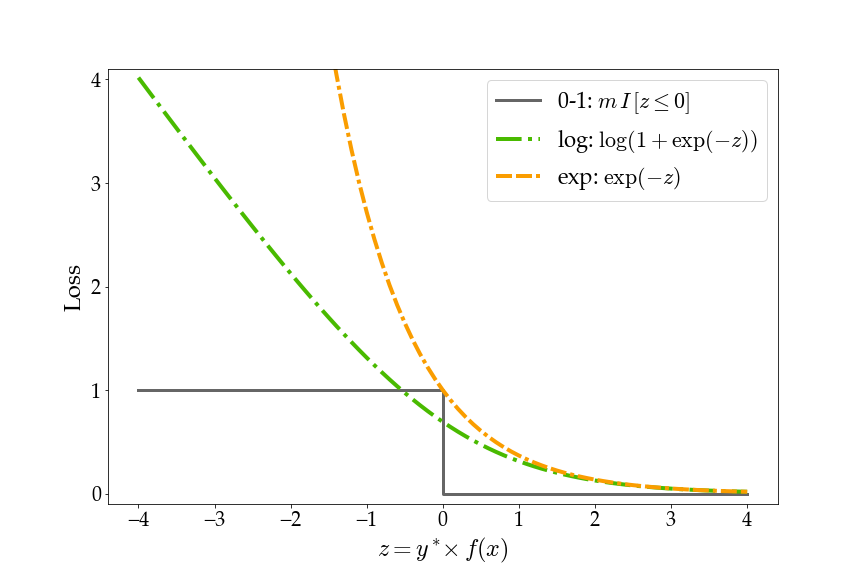
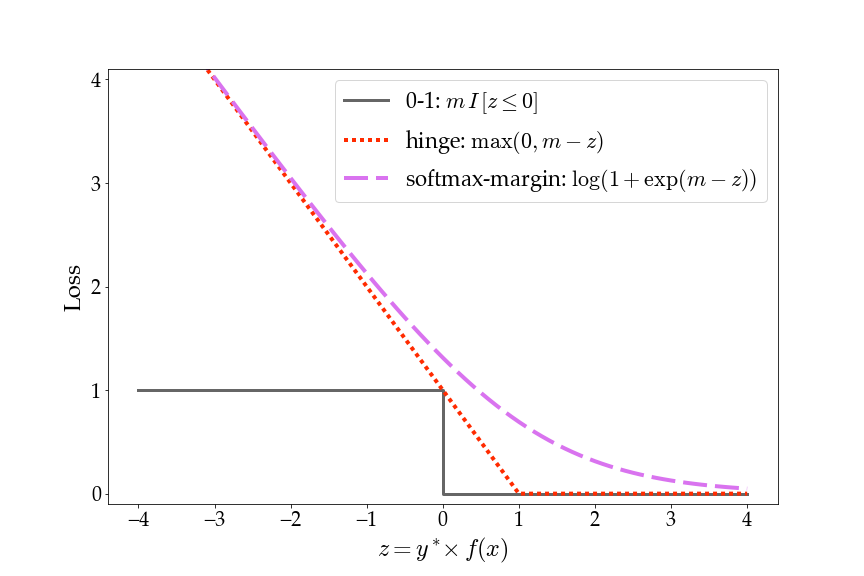
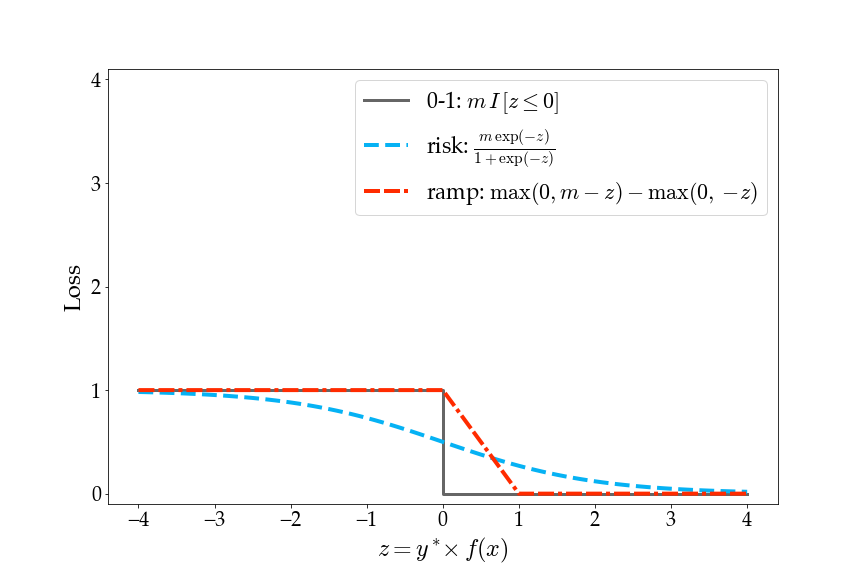
The horizontal axis, z, represents the ground truth output y* multiplied by the classifier score f(x) for an input x. Since this is binary classification, y* is either -1 or 1 and f(x) is a scalar.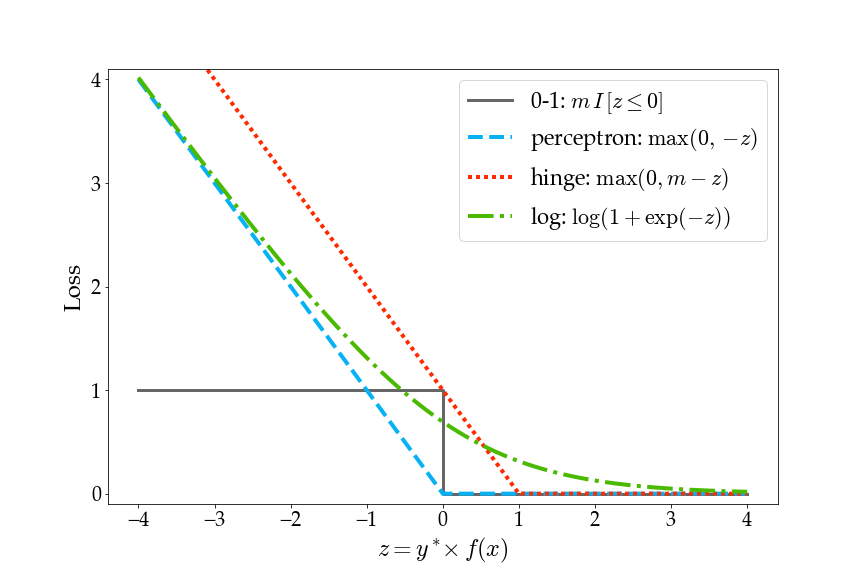
Please contact me with issues, bug reports, etc.
 All materials on this page are released under CC0 1.0 Universal (public domain).
Back to my teaching materials.
This page hosts a Jupyter Notebook for plotting loss functions for binary classification.
Downloads:
- lossviz.ipynb: notebook for generating loss function plots
- loss-pdf.zip: pdf files of the example plots below
- loss-png.zip: png files of the example plots below
The horizontal axis, z, represents the ground truth output y* multiplied by the classifier score f(x) for an input x. Since this is binary classification, y* is either -1 or 1 and f(x) is a scalar.
Please contact me with issues, bug reports, etc.
All materials on this page are released under CC0 1.0 Universal (public domain).Back to my teaching materials.